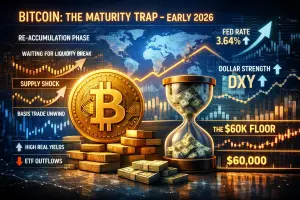
When Bitcoin stops moving, it rarely feels neutral. It feels personal. The chart turns into a Rorschach test where optimists see a calm base before the next leg up and skeptics see the first quiet step into a colder market. In early 2026, the confusion is sharper because the backdrop looks split screen. U.S. equities have been printing fresh highs while Bitcoin has struggled to turn strength into follow through.
The core question is simple. Is this a normal cooldown before the next rally, or the early shape of a bear phase where every bounce gets sold? The answer is not hidden in a single indicator. It shows up in how liquidity behaves, how leverage rebuilds, and whether real buyers appear when the market tests uncomfortable levels.
Why the stock market matters more than crypto wants to admit
Bitcoin traders love the idea that crypto is its own universe, but price still reacts to the same oxygen as everything else. That oxygen is liquidity. When financial conditions loosen, risk assets tend to float together. When conditions tighten or uncertainty spikes, correlations rise and the weakest chart tends to show it first.
That is why the recent divergence has become such a talking point. If equities can grind upward while Bitcoin chops sideways, it can mean two very different things. Either Bitcoin is lagging and preparing to catch up, or crypto is quietly losing marginal demand while traditional risk assets keep the spotlight.
If you want a quick refresher on how the equity signal has been showing up in crypto coverage on MrsCoins, start with this recent look at the S&P signal and Bitcoin lag. The useful part is not the number. It is the idea that Bitcoin often reacts with a delay when macro risk appetite changes.
The cleanest explanation for a “stall” is a fight over positioning
In a real bear phase, selling pressure is usually obvious. Support breaks, rebounds look weak, and volume shows urgency on down days. A stall looks different. The market is busy, but the net result is flat because participants are trading risk back and forth.
Here is what tends to be happening under the surface during these stretches.
- Short term leverage gets washed out as late longs discover that “support” is not a promise.
- Spot buyers become picky and wait for cleaner discounts or clearer catalysts.
- Longer term holders test conviction by reducing risk into rallies and rebuying only if the market proves it can hold a floor.
This is why the same sideways week can feel bullish to one trader and bearish to another. The tape is basically a negotiation over who is willing to carry inventory into the next headline.
ETF flows are the closest thing crypto has to a truth serum
If you want one place to watch for reality, watch flows. Spot Bitcoin ETFs have turned Bitcoin into something closer to a macro trade. That comes with benefits, like deeper access and more institutional plumbing, and costs, like more sensitivity to risk rotations and rebalancing.
When ETF flows are consistently positive, sideways price action often acts like a loading zone. When flows turn negative for days in a row, the same sideways price action can be a ceiling, a slow bleed where buyers refuse to chase.
MrsCoins already has a practical explainer that helps readers understand why this matters, and it is worth linking here because it changes how you read “support” in 2026. See how Bitcoin ETFs work and why flows move the market.
A range becomes dangerous when support stops attracting real buyers
Most traders talk about resistance like it is the main character. In reality, support is the more honest signal. Resistance is where sellers show up. Support is where buyers either reveal themselves or disappear.
In a healthy pause, dips get bought with enough force that the market snaps back quickly. That does not guarantee a rally, but it tells you demand still exists. In a bear turn, dips get bought more softly. The market bounces, but it takes longer, and each rebound feels thinner. That is the market saying it needs lower prices to clear the next wave of supply.
If you are trying to separate “pause” from “bear,” watch the quality of the rebound. Does it reclaim key levels quickly and hold them, or does it drift back down as if gravity got heavier?
Macro is still the boss, even when crypto thinks it is not
In 2026, the market is more sensitive to rates and inflation prints than many crypto natives like to admit. A stall can simply be Bitcoin waiting for clarity on the next macro impulse. A bear phase often begins when macro uncertainty rises and investors decide they do not need to take risk in the most volatile corner of the room.
This is also where stablecoins matter, not as a narrative, but as a measurable piece of liquidity. When stablecoin supply expands and on chain settlement grows, the ecosystem has more dry powder. When it contracts, rallies tend to feel more fragile.
For readers who want the policy and plumbing context, this GENIUS Act stablecoin rulebook breakdown is a useful anchor. Regulation is not just headlines. It affects how fast capital can move, what institutions are allowed to touch, and where stablecoin liquidity concentrates.
The November crash still shapes trader behavior
Markets have memory. Even if the price has moved away from the panic, traders remember the speed of the drop. That changes how they react to the next bout of weakness. If the market recently experienced a sharp selloff, participants tend to sell rallies sooner and trust breakouts less until the tape proves otherwise.
If you want to reconnect that psychological thread, revisit the November 2025 market crash analysis. The key takeaway is not fear. It is how quickly liquidity can vanish when too many traders are leaning the same way.
So will history repeat itself within a few months
It can, but history does not repeat on schedule. The pattern people are usually referring to is a lag relationship where Bitcoin reacts after equities or after liquidity conditions shift. Sometimes that lag resolves with a catch up rally. Other times it resolves with a late breakdown that surprises traders who assumed the delay was bullish.
The better way to frame it is with two practical questions.
Is the market building stronger demand at higher lows, or is it simply failing to rally? Stronger demand shows up as quick dip buying, improving spot volume on green days, and less reliance on leverage to push price.
Are flows stabilizing, or are they still leaking? If the biggest easy access vehicles are seeing persistent outflows, rallies have to work harder. They can still happen, but they tend to be sharper, shorter, and more news driven.
If you want a broader, reader friendly roadmap for scenarios, MrsCoins already published a forward looking piece that can be referenced without repeating it here. See the 2026 Bitcoin recovery scenario guide for a structured way to think about upside and downside paths.
A calm checklist without the hype
Here is the simplest way to track this without staring at the chart all day. If most of these improve together, a stall is more likely a pause before the next rally. If most of these worsen together, the bear case gains weight.
- ETF flows stop bleeding and begin to stabilize over multiple sessions.
- Funding rates cool without price collapsing, which suggests leverage is resetting rather than panicking.
- Dips are bought quickly and the market reclaims prior levels without immediately giving them back.
- Volatility compresses and then expands upward, not downward, with clear spot participation.
None of this guarantees a rally. It simply improves the odds that the market is building a base instead of losing structure.
Where this leaves Bitcoin right now
If Bitcoin is stalling while equities are strong, the market is basically asking for proof. Proof that real buyers will step in without being bribed by lower prices. Proof that the next macro headline will not be the excuse for another fast flush. Proof that flows can turn from a headwind into a tailwind again.
That is why a range is not boring, even when it looks that way. A range is where the next trend gets negotiated. The outcome will feel obvious in hindsight. In real time, it shows up as small but repeated tells in flows, liquidity, and how the market behaves when it gets nudged off balance.
For You Notes…
Market context and equity moves were cross checked against major financial market coverage including MarketWatch and Barron’s. ETF flow narratives and crypto market commentary were cross checked against CoinDesk, The Block, and public ETF flow dashboards widely used by traders such as Coinglass and SoSoValue. This article is analysis, not financial advice.